The Physical Governance Journey
Our Process
Why the order matters.
Every industrial facility runs on a picture of itself: drawings, models, spreadsheets, and memory. Over time that picture stops matching the plant. Physical governance is the discipline of keeping the picture true, so every decision about the plant is made against the plant as it actually is.
The journey has three steps. You cannot skip one, because each is built on the one before it. But each stands on its own and delivers value the day it lands.
Need help?
Call us to speak with one of our experts
The journey at a glance
Three steps. One measured foundation.
Most clients start with a single area or a single problem. The journey scales from there, at your pace. Here is the whole thing on one screen.
01 Reality Capture
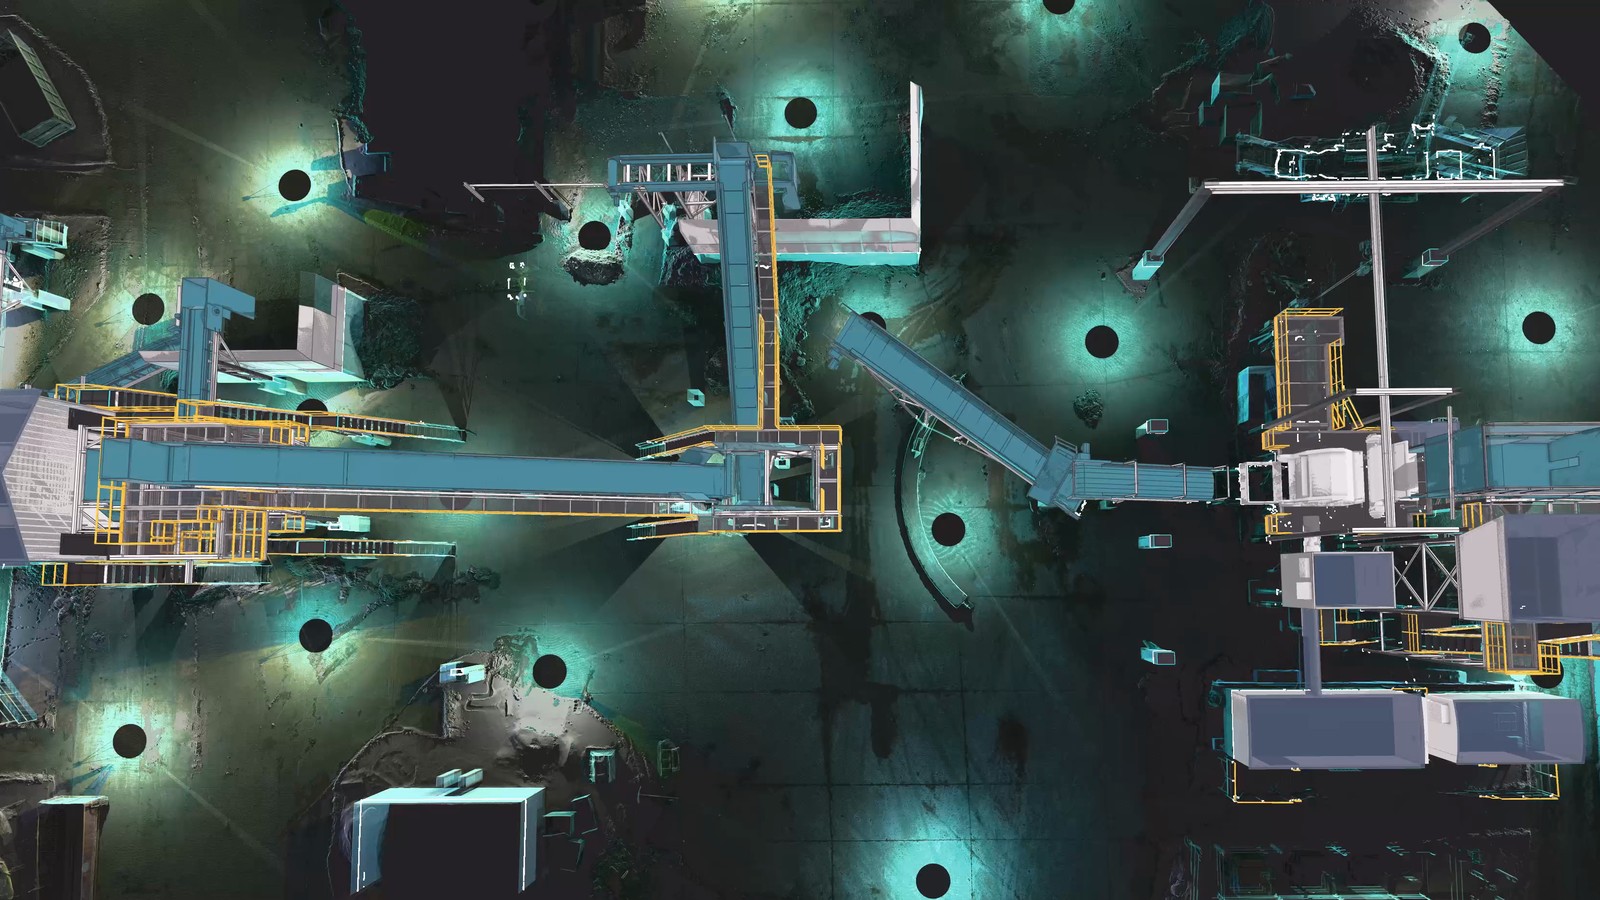
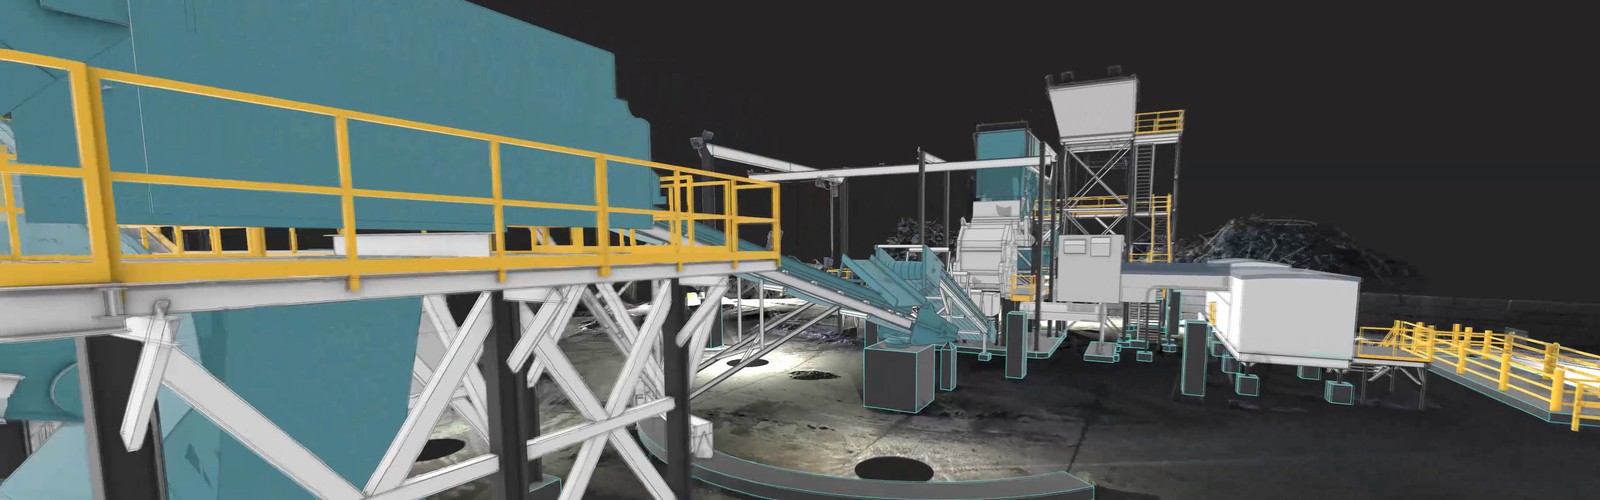
We measure your facility as it actually is today, to 1/8 inch, while you keep running. One trusted data set replaces every out-of-date drawing.
02 Visual Twin
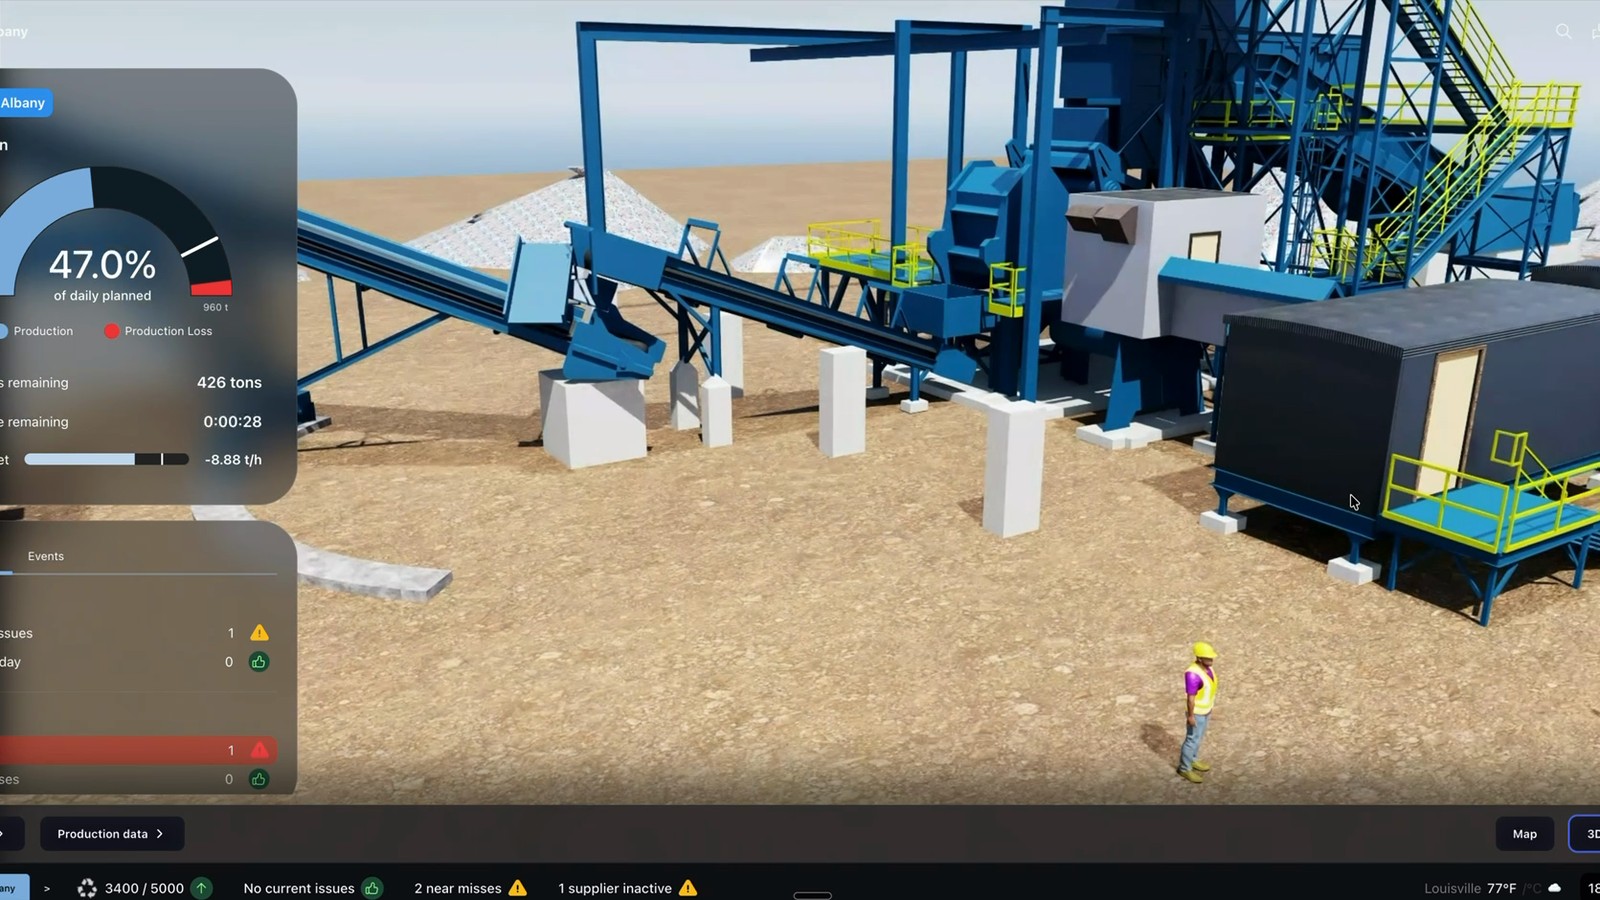
That data becomes a browser-based model your teams use every day for maintenance, projects, safety, and training. Standalone value from day one.
03 Digital Twin
Once your team lives in the twin, we connect it to the systems that run the plant. Live data on real geometry, flowing both ways.
Step 01
Reality Capture: get the truth first.
Everything starts with capture. Sometimes we come to your site and scan. Sometimes you invite us in for one area or one outage. Sometimes you already have scan data and we ingest it. The method is flexible. The rule is not: nothing gets built until reality has been measured.
Terrestrial laser scanning is the main tool, with UAV capture for yards, rooftops, and stockpiles. We work around production. Standard delivery is seven days, as fast as 72 hours when a project needs it.
Step 02
Visual Twin: put reality in everyone’s hands.
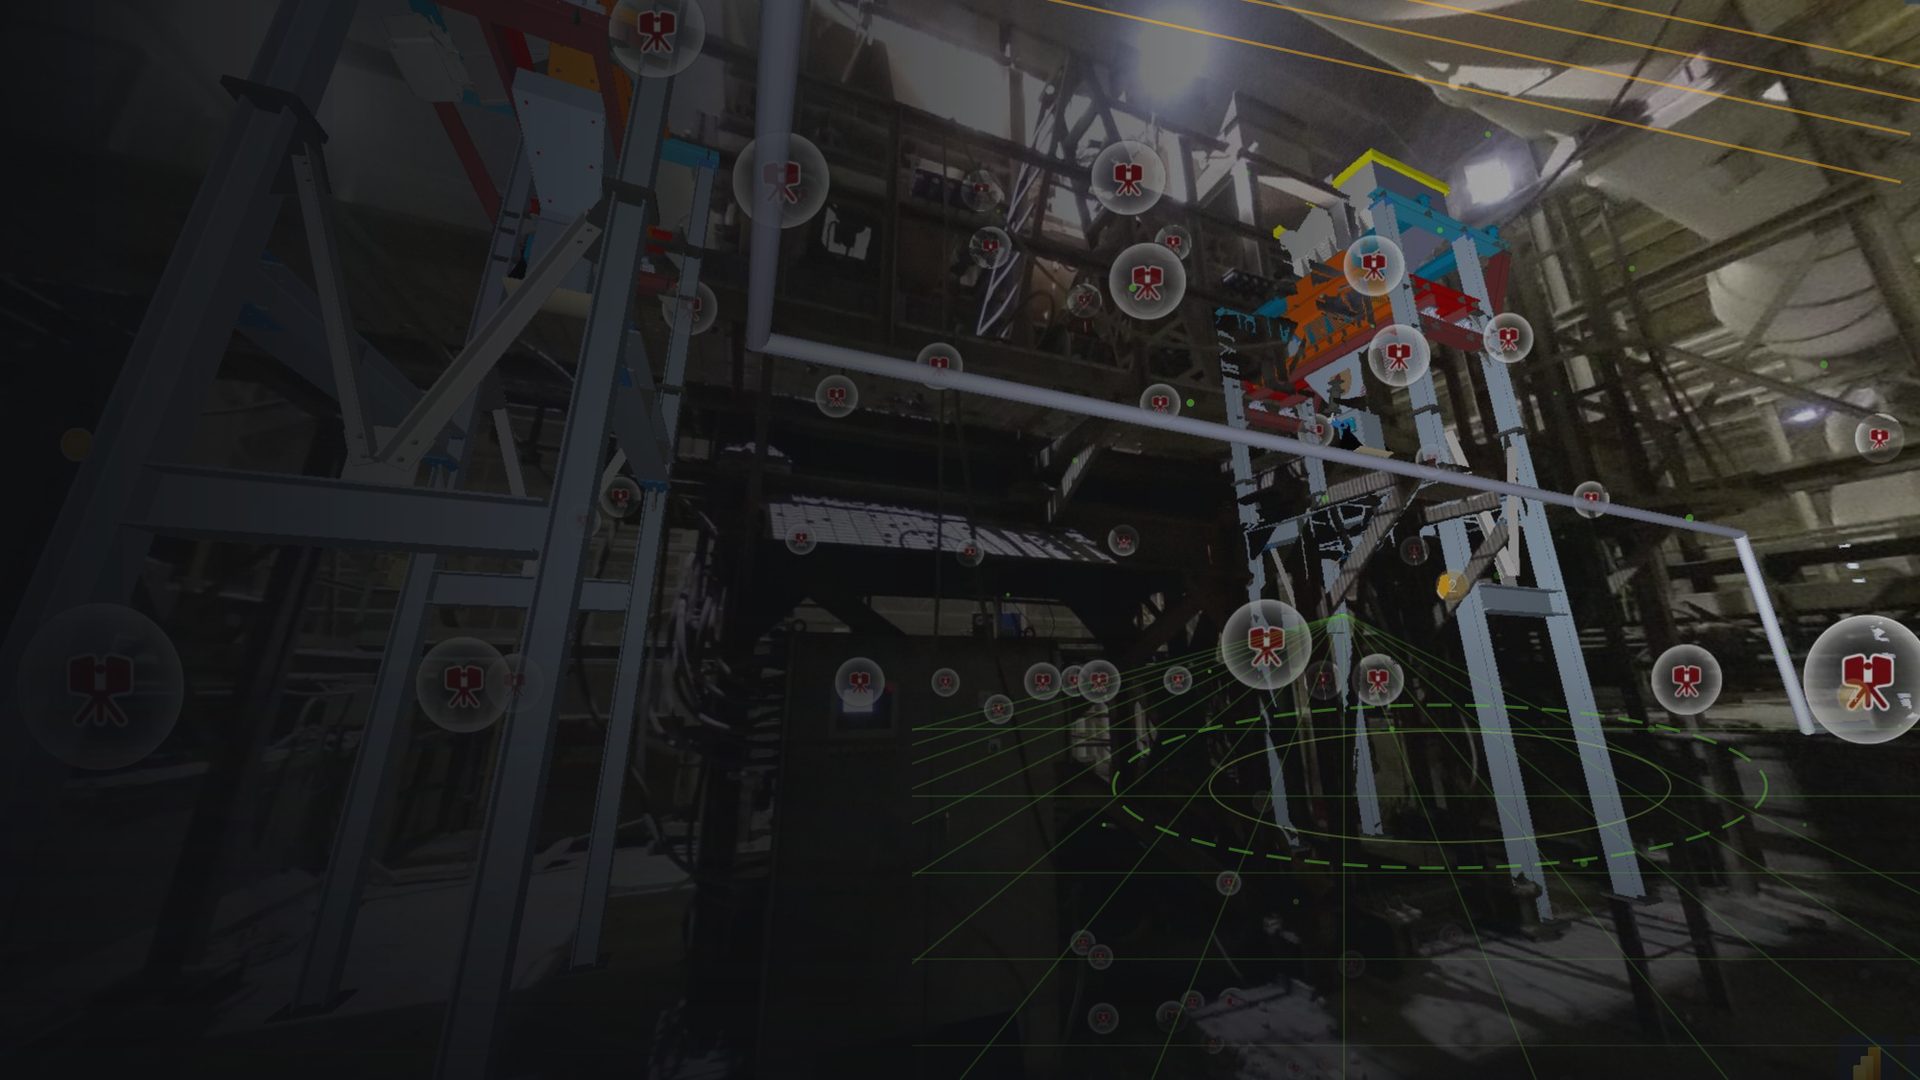
The capture becomes a visual twin on a web-based platform like Cintoo, NavVis IVION, or Prevu3D. Nothing to install. Maintenance planners pull clearances from a desk. Capital projects design against real geometry. Safety walks crews through crane paths and confined spaces before they enter.
The visual twin is reality-based, just like a digital twin, and it has standalone value from day one. We train your team until the twin is part of how the plant works. That is the moment the next step becomes possible.
Step 03
Digital Twin: connect the plant to the model.
A visual twin shows you the plant. A digital twin runs with it. Once your team is trained and living in the twin, we start layering in the technology that turns it into an operating system for the facility: IT and OT data, SCADA, computer vision, machine learning, and AI.
Data flows both ways, from the twin to the enterprise and back, so the model reflects the plant in real time and the plant benefits from what the model knows. Every layer is tied to a business outcome you can measure.
Spartan Operational Reality Program
Keep the twin true. Unlock the tools.
A plant never stops changing, so the twin cannot either. The Spartan Operational Reality Program is an annual membership that keeps your twin current with scheduled rescans and unlocks tools like Physical Drift Monitor, which compares each new scan to the last and reports what moved, where, and by how much.
Ask about the full list of member perks on your demo.
BLog
Related Article
FAQ
Frequently Asked Questions
Frequently asked questions
Can you scan a steel mill while it is running?
Yes. We plan capture around your production schedule and crane movement, so documentation gets created without scheduling downtime for it. Areas open and close on the production schedule and the scan plan follows the mill.
Does heat from furnaces and casters affect scan accuracy?
It can. Air above hot metal shimmers, and that shimmer distorts optical measurement and adds noise near the heat source. We plan setups and timing around thermal conditions and verify against control so the registered cloud holds tolerance.
What can our team do with the scan?
Plan tie-ins against real geometry, check clearances before a lift, design new steel to measured conditions, coordinate contractors around accurate access routes, and build turnaround work packages that reflect the plant as it stands rather than as it was drawn.
How does this reduce downtime?
Most expensive failures come from good decisions made against wrong information. When the documented plant and the physical plant disagree, the clash surfaces during the outage when every hour carries the highest cost. Planning against measured geometry moves that discovery to a screen, weeks earlier.
How fast can we get usable documentation?
A working visual twin in as little as 72 hours after the site visit. Field time depends on the area and how congested it is, but delivery of the usable model does not.